The Nifty Midcap 150 and Nifty Smallcap 250 indices surged by about 28% each in the first eight months of 2024. These indices have outperformed the benchmark index, Nifty50, which is up by 16% over the same period.
This significant outperformance is partly due to the frequent sector rotations, where different sectors have taken turns leading the market each month.
Among these, the diamond and jewellery segment has garnered attention, even though it lacks a dedicated sector index from NSE or BSE.
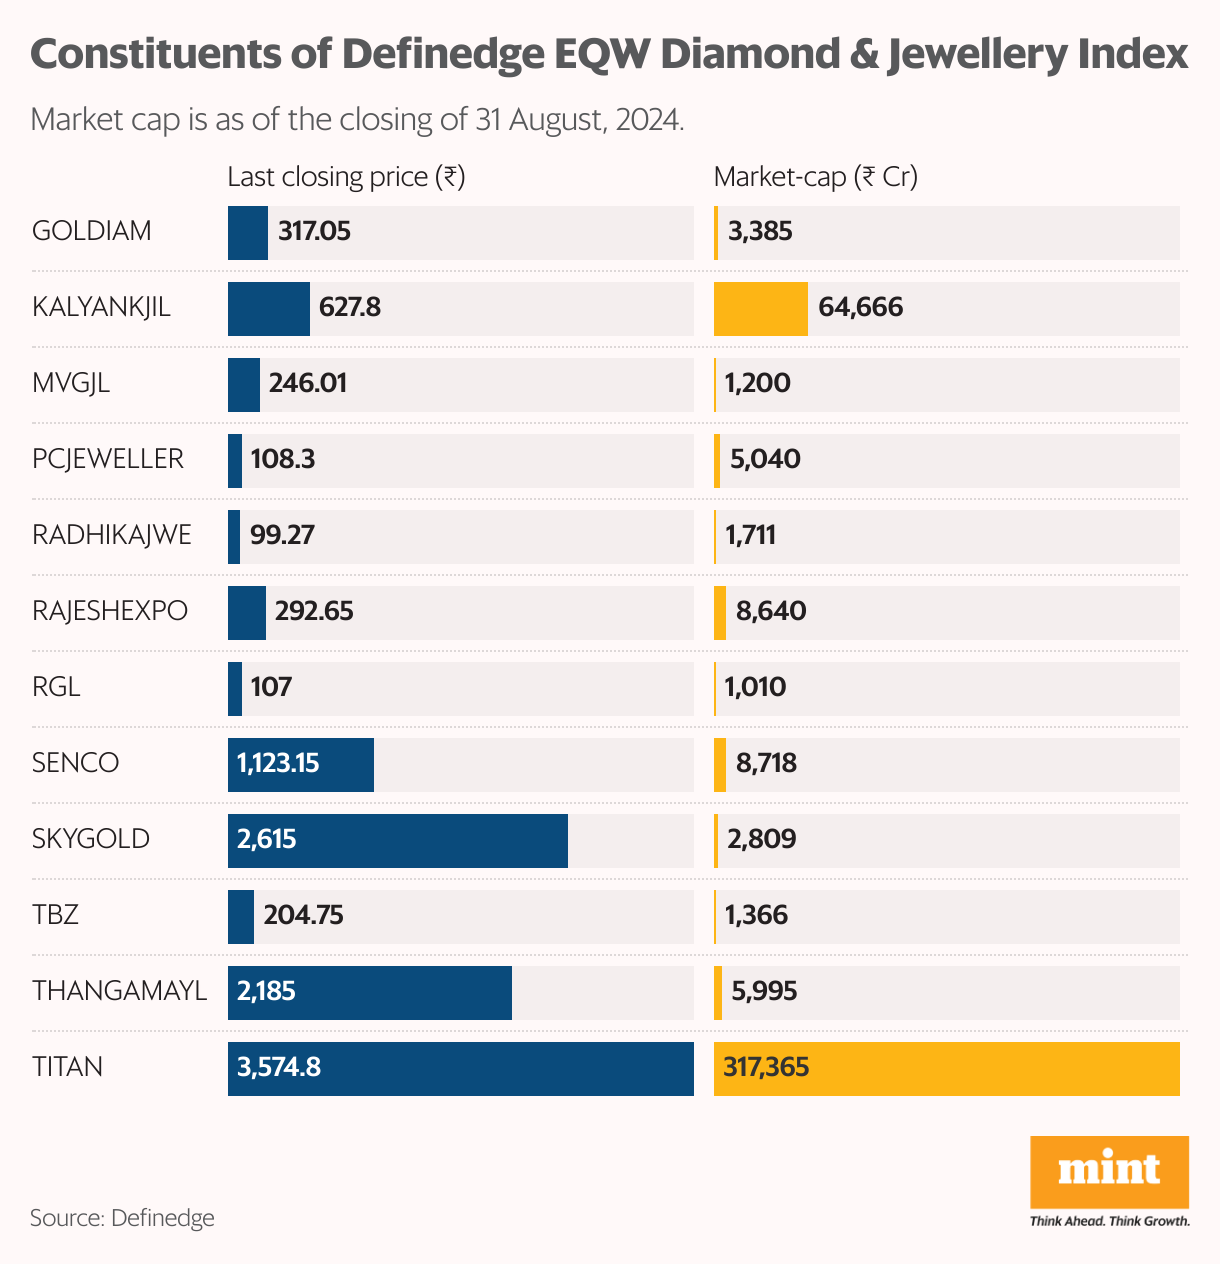
To fill this gap, we have created the Definedge EQW Diamond & Jewellery Index, an equal-weighted index comprising 12 diamond and jewellery sector stocks. This index offers a more focused view of the sector’s performance, providing insights into its trends and potential future movements.
Definedge EQW Diamond & Jewellery Index
The Definedge Equal Weighted (EQW) Diamond and Jewellery Index is designed to give equal importance to each of its 12 constituent stocks regardless of their market capitalisations. This approach allows us to track the sector’s overall performance without the skew that can result from a few large-cap stocks dominating the index.
Before checking the specific stocks, let’s examine the technical setup of the index to understand where the market might be heading.
Definedge EQW Diamond & Jewellery Index

View Full Image
On the 3% X 3 Point & Figure (P&F) daily chart, the Definedge EQW Diamond & Jewellery Index has historically broken through its resistance zones, which now act as strong support levels.
What is a P&F Chart?
A point-and-figure chart is a chart method using Xs and Os. The X denotes bullish moves, while O denotes bearish moves. Unlike traditional time-based charts, P&F charts focus solely on price changes and are considered “noiseless”. They filter out minor price fluctuations, highlighting significant trends and reversals. The lack of time constraints gives a clearer picture of supply and demand dynamics, helping chartists make more informed decisions.
In the Definedge EQW Diamond & Jewellery Index P&F chart, every breakout from a resistance level has been retested, a crucial technical analysis characteristic. A successful retest often confirms the validity of a breakout, providing a promising entry point due to the favourable risk-reward ratio.
The most recent breakout was followed by a 45-degree trendline, which indicates a robust upward trend. This was further confirmed by the Anchor Column Follow Through (AFT), marked by a blue line on the chart. The AFT indicates the resumption of bullish momentum, suggesting that the index has more room to move higher.
With short-term and long-term chart patterns pointing towards a continued bullish trend, it is worth examining some key stocks within the index that could lead this charge.
1. Titan Co. Ltd
Titan, one of India’s most prominent jewellery brands, has a significant market presence in watches, eyewear, and other lifestyle products. Its Tanishq jewellery brand has carved a niche among Indian consumers. Titan’s robust business model, strong brand loyalty, and extensive retail network make it a key player in the jewellery sector.
When we speak about Titan, how can we forget the legend of the Late Shri Rakesh Jhunjhunwala, whose success story is well-known in the stock market.
Titan, Candlestick Chart

View Full Image
On the weekly chart, Titan’s stock price has consistently made higher highs and higher lows, a classic bullish pattern according to Dow Theory. This pattern suggests that demand for the stock is outstripping supply, pushing prices higher over time.
Since the reversal from the pandemic-induced fall, Titan has found strong support at the 100-weekly Exponential Moving Average (WEMA) Channel, which is created using the 100-weekly EMA high and low.
The stock price found support at this channel in 2021 and 2022, and multiple instances in 2024 indicate that the bulls have maintained control.
Furthermore, the breakout from a diamond pattern on the daily chart adds further conviction to the bullish thesis. The combination of these technical indicators suggests that Titan is well-positioned for a potential continued upside.
2. Tribhovandas Bhimji Zaveri Ltd (TBZ)
Tribhovandas Bhimji Zaveri is a household name in India with a legacy spanning over 150 years. Known for its high-quality craftsmanship and exquisite jewellery designs, TBZ has established a strong brand presence across India.
What stands out about TBZ is the recent surge in monthly trading volumes, which have been the highest for two consecutive months, in July and August. This surge in volume often precedes significant price movements and can be a strong indicator of institutional interest.
To better understand the price action of TBZ, we can look at the Wyckoff Theory. This advanced technical analysis method identifies a stock’s accumulation and distribution phases. The Wyckoff method focuses on the psychology of market participants, identifying how smart money operates within the market.
TBZ, Bar Chart

View Full Image
The monthly chart for TBZ, which dates back to 2012, shows a clear Wyckoff accumulation pattern.
After hitting an all-time high of ₹252 in December 2012, the stock entered a preliminary selling phase, followed by a selling climax that marked the end of the downtrend. This phase was characterised by high volumes, suggesting intense selling pressure.
Following the selling climax, TBZ experienced an automatic rally, often serving as a bull trap in Wyckoff’s analysis. The subsequent decline, marked by lower volumes, took the stock to its 52-week low. However, the lack of volume during this decline suggested that selling pressure was waning, setting the stage for a reversal.
The spring or shakeout phase followed, during which the stock briefly broke its lows before reversing on higher volumes, indicating the exhaustion of sellers. This marked the beginning of the accumulation phase, during which smart money quietly accumulates shares in anticipation of a future uptrend.
Since the pandemic, TBZ has seen a significant uptick in volume (marked red arrow on the chart), particularly in December 2020 and January 2021. This marks the beginning of Phase C in Wyckoff’s accumulation model. This phase is often where the last point of support (LPS) forms, creating a higher low and signalling a bullish reversal.
As TBZ breaks above its multi-year high of ₹135, the stock is now entering Phase D, where the markup phase begins. This phase is characterised by increasing prices and higher volumes, suggesting that the base is firmly in place and that potentially a further upside is likely.
3. Kalyan Jewellers India Ltd
Kalyan Jewellers is another prominent name in the Indian jewellery market. With a vast network of showrooms across India and West Asia, Kalyan has built a strong brand that is recognised for its wide range of jewellery offerings and deep-rooted trust among customers.
Kalyan Jewellers, P&F Chart

View Full Image
The Point & Figure (P&F) chart for Kalyan Jewellers provides a unique perspective on its price trends.
Kalyan Jewellers has been trending bullishly on the 1% X 3 daily P&F chart, forming higher bottoms since the stock was trading in double digits.
The D-Smart line, a proprietary indicator used in the P&F chart, adds another layer of analysis. This indicator comprises two lines: the walking line, which adjusts its pace steadily according to market conditions, and the running line, which reacts more aggressively to market trends. Together, these lines create a cloud that helps chartist visualise the stock’s trend.
The stock price has recently formed a base at the walking line, indicating strong support. The subsequent breakout from the consolidation zone, marked by an Anchor Column Follow-Through (AFT), signals a resumption of bullish momentum. The bullish cloud created by the D-Smart line further supports the view that the bulls are in control of the trend.
To summarise, the Definedge EQW Diamond & Jewellery Index, along with the individual performances of Titan, TBZ, and Kalyan Jewellers, suggests that India’s diamond and jewellery sector is poised for a strong uptrend. The technical setups across these stocks show bullish patterns, each displaying unique characteristics supporting further trends.
In conclusion, stock prices can move for various reasons. The ones discussed above are only one aspect of what goes into determining the movement of share prices. Keep track of how these trends play out and observe what factors matter the most. This should help you become a more effective trader.
Note: The purpose of this article is only to share interesting charts, data points and thought-provoking opinions. It is NOT a recommendation. If you wish to consider an investment, you are strongly advised to consult your advisor. This article is strictly for educative purposes only.
Brijesh Bhatia has over 18 years of experience in India’s financial markets as a trader and technical analyst. He has worked with the likes of UTI, Asit C Mehta, and Edelweiss Securities. Presently he is an analyst at Definedge.
Disclosure: The writer or his dependents may or may not hold the stocks/commodities/cryptos/any other asset discussed here.